
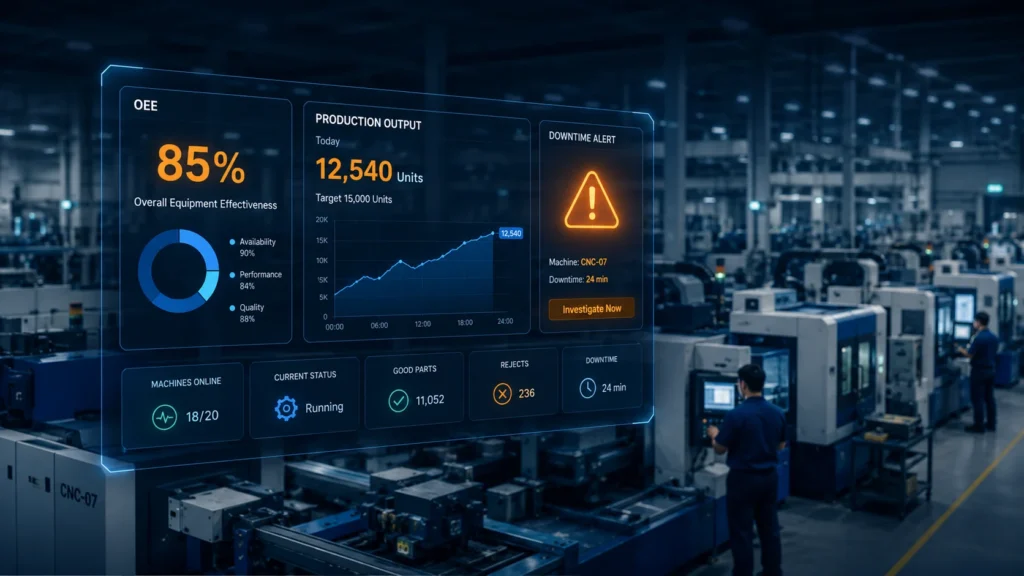
Walk onto most shop floors across Coimbatore and Tirupur, and you’ll still find the same scene: a supervisor flipping through a logbook, a plant head waiting for an end-of-day Excel report, and a production number that nobody can confirm until the next morning. By the time a machine downtime issue or a quality dip shows up in the “official” report, the shift is already over and the output loss is already locked in.
This is the real cost of running a manufacturing unit without visibility. Not a lack of effort, but a lack of real-time data. That’s exactly the gap production analytics software is built to close, turning scattered shop-floor information into a single live view of what’s actually happening on your production line right now.
In this post, we’ll walk through how Chirix ERP’s Production Analytics Module works, what makes it different from the reporting systems most SMEs already have, and how manufacturers in Coimbatore and Tirupur are using it to cut downtime and boost output. Stick around till the end; you’ll see exactly how to book a free, no-obligation demo.
What Is Production Analytics Software (And Why Manufacturers Are Switching to It)
Production analytics software is a system that collects real-time data from your shop floor machine run time, output volumes, downtime events, and quality rejections and converts them into dashboards and reports that plant managers can act on immediately. Instead of waiting for someone to manually compile numbers at the end of a shift, decision-makers see production performance as it happens.
The Shift from Manual MIS Reports to Real-Time Dashboards
Traditional MIS reporting depends on someone manually pulling data from machine logs, job cards, and Excel sheets, usually once a day, sometimes once a week. By the time the report reaches a decision-maker, the window to act on a bottleneck or a quality issue has already closed. Production analytics software removes this lag entirely. Data flows in continuously, and dashboards update as production happens, not after it.
Why Tirupur & Coimbatore SMEs Are Adopting Analytics-Driven ERP
Manufacturing clusters around Tirupur’s garment and knitwear units and Coimbatore’s engineering and pump industry estates are under growing pressure from tighter export compliance timelines, rising raw material costs, and buyers who expect on-time dispatch with full traceability. SMEs in these clusters are increasingly moving to analytics-driven ERP systems because manual tracking simply can’t keep pace with multi-shift, multi-line operations anymore. Local industry bodies and cluster associations have also pushed digitisation as a competitiveness issue, not just an efficiency one, which is accelerating adoption across small- and mid-sized units in the region.
Inside Chirix ERP’s Production Analytics Module
Chirix ERP’s Production Analytics Module is built specifically for manufacturing and packaging environments, not adapted from generic business intelligence software. Here’s what’s inside it.
Real-Time OEE Tracking (Availability, Performance, and Quality)
The module continuously calculates Overall Equipment Effectiveness (OEE) by tracking the three components that matter most, machine availability, performance against ideal cycle time, and quality yield, and Instead of calculating OEE manually at month-end, plant managers see it update shift by shift, machine by machine.
Live Dashboard Views for Shop Floor Supervisors and Plant Heads
Different roles need different views. Shop floor supervisors get line-level dashboards showing current run status and immediate blockers. Plant heads get a consolidated view across all lines and shifts, so they can compare performance without asking for separate reports from each supervisor.
Job Work Order & Dispatch Visibility in One Screen
For manufacturers who rely heavily on job work and sending semi-finished goods out for processing and tracking their return, the module ties job work order status directly into the production dashboard. Combined with dispatch tracking, this gives a single-screen view from raw material to outbound shipment.
Downtime and Bottleneck Root-Cause Alerts
Rather than just reporting that a line was down, the module flags likely causes—machine breakdown, material shortage, and changeover delay—as they happen so supervisors can respond before the shift ends instead of investigating the next day.
How the Production Analytics Module Boosts Output — By the Numbers
Case Snapshot – Jebin T, Coimbatore
A mid-sized engineering components manufacturer in Coimbatore adopted the Production Analytics Module to address recurring downtime on two critical machining lines. Within the first quarter of use, real-time OEE tracking helped the team identify a recurring changeover delay that had gone unnoticed in manual reports for months.
Case Snapshot – Michael P, Tirupur
A garment export unit in Tirupur used the module’s dispatch and job work visibility features to tighten turnaround on outsourced processing stages, which had previously caused unpredictable delays ahead of shipment deadlines.
Production Analytics Software vs. Traditional Reporting Tools
| Feature | Manual/Excel Reporting | Chirix ERP Production Analytics |
|---|---|---|
| Update Frequency | Daily or weekly, manually compiled | Real-time, automatic |
| OEE Calculation | Manual, prone to error | Automated, continuous |
| GST/E-Waybill Sync | Maintained in a separate system | Integrated within the platform |
| Multi-Plant Visibility | Difficult to scale, needs manual consolidation | Centralized dashboard across units |
| Downtime Root-Cause Tracking | Identified after the fact, if at all | Flagged in real time |
Key Features That Set Chirix ERP Apart
BOM & MRP-Linked Production Insights
Production data doesn’t sit in isolation; the module ties output directly to Bill of Materials and Material Requirement Planning data, so managers can see not just how much was produced but how efficiently material was consumed against plan.
GST-Compliant Reporting Built Into Analytics
For Indian manufacturers, compliance isn’t optional. The module keeps GST-relevant production and dispatch data structured correctly from the start, reducing the reconciliation work usually needed before filing.
Mobile Dashboard Access for Plant Managers On the Move
Plant heads who split time between multiple units or travel for supplier and buyer meetings can check live dashboards from a phone without needing to be at a desktop terminal on-site.
Custom Alerts for OEE Drops and Delay Risks
Rather than requiring managers to actively check dashboards, the system can push alerts when OEE drops below a set threshold or when a job work order risks missing its expected return date.
Who Should Book a Demo?
Manufacturing SMEs Scaling Beyond Spreadsheets
If your team is still consolidating multiple Excel sheets by hand to understand daily production, you’ve likely already outgrown manual tracking — even if it doesn’t feel that way yet.
Packaging & Garment Exporters Needing Compliance-Ready Reporting
Exporters facing buyer audits and compliance deadlines benefit directly from a system where production, dispatch, and GST data are already aligned, rather than reconciled after the fact.
Multi-Unit Operations Across Coimbatore & Tirupur
Manufacturers running more than one unit, a common setup across both clusters, get the most value from centralised visibility that doesn’t depend on each plant reporting separately.
What Happens When You Book a Free Demo
Step 1 – 15-Minute Discovery Call
A quick conversation to understand your current production tracking setup, pain points, and what you’d want visible on day one.
Step 2 – Live Walkthrough of Your Production Data Use Case
Rather than a generic product tour, the demo is built around a scenario close to your actual shop floor — whether that’s OEE tracking, job work visibility, or dispatch monitoring.
Step 3 – Custom ROI Estimate for Your Plant
Based on your current output and downtime patterns, you’ll get a realistic estimate of where the Production Analytics Module could move the needle first.
Book Your Free Demo Today
Frequently Asked Questions
It tracks real-time shop-floor data such as machine uptime, output volumes, OEE (availability, performance, and quality), downtime events, and job work order status, converting this into live dashboards for decision-makers.
Yes. The Production Analytics Module is designed to scale from single-unit operations to multi-plant setups, making it suitable for both small manufacturing units and larger multi-line operations common across these clusters.
The initial discovery call typically takes 15 minutes, with the live walkthrough scheduled shortly after based on your availability.
Yes, production insights are linked directly to your Bill of Materials and Material Requirement Planning data within Chirix ERP.
Yes, GST-relevant production and dispatch data is structured within the platform, reducing manual reconciliation before filing.
See It Work on Your Own Shop Floor
Manual reporting will always tell you what already happened. Production analytics software tells you what’s happening right now — while there’s still time to act on it. Whether it’s catching a downtime pattern before it repeats for the tenth time or making sure a job work order comes back before it delays dispatch, the difference shows up in your output numbers within the first few weeks.
See Your Plant’s Numbers Live